Lovable AI Debugging: A Founder's Guide to Bulletproof Internal Apps
You used Lovable AI to build a gamechanging internal app with just a few prompts—a process that felt like magic. But what happens when the magic sputters and the app breaks? This guide demystifies debugging for nontechnical founders by showing you exactly how to build simple, powerful logging and...

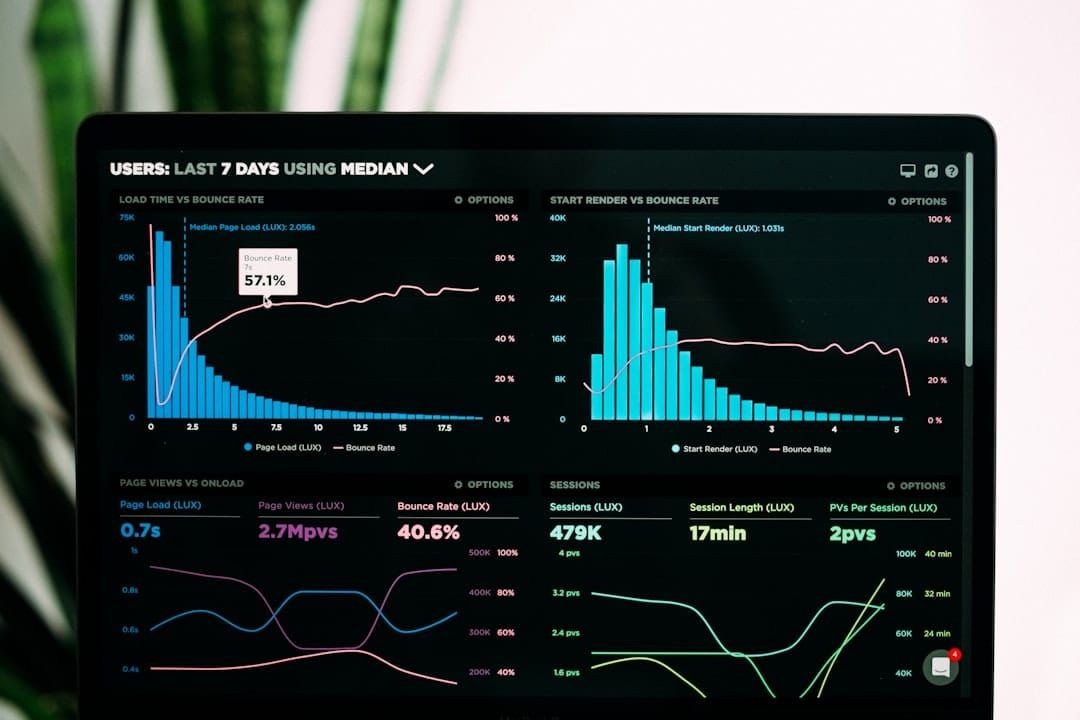
You used Lovable AI to build a game-changing internal app with just a few prompts—a process that felt like magic. But what happens when the magic sputters and the app breaks? This guide demystifies debugging for non-technical founders by showing you exactly how to build simple, powerful logging and error-tracking features directly within your Lovable application, turning you from a builder into a master maintainer.
Key Takeaways: Your Debugging Blueprint
- Start Today: Treat 'debugging' as a feature you build, not a problem you react to. Your first step is to prompt Lovable to create a simple data table to log user actions.
- Isolate Failures: Create a second data table specifically for 'Error Logs'. Instruct Lovable to add an entry anytime a workflow fails or an unexpected result occurs.
- Build a Dashboard: Don't let logs be invisible. Create a new, protected page in your app called 'Admin Dashboard' to display your action and error logs in a readable, filterable table.
- Use AI to Analyze AI: Point Lovable's own AI at your log tables. Use prompts like 'Review the Error Log and summarize the top 3 most common errors from the last 7 days.'
- Reconstruct, Don't Guess: Instead of asking a user 'what did you do?', find their user ID in the Action Log and review the step-by-step sequence that led to the error.
- Close the Loop: Use the insights from your logs to write better, more specific prompts to fix the root cause of the error and improve your app's logic.
Table of contents
- What Really Breaks in an AI-Built App?
- Your First Step: Building a Simple 'Action Log' Feature
- How to Track Errors Without Writing Any Code
- Designing Your 'Debugger's Dashboard' in Lovable
- Using Lovable's AI to Analyze Your Own Logs
- Crafting the Right Prompts to Find and Fix Bugs
- Replaying a User Session: The Low-Code Method
- Closing the Loop: A Framework for Continuous Improvement
- Preventative Maintenance: Running a Monthly 'Health Check'
- When to Call a Human: Recognizing AI's Limits
- Conclusion and Next Steps
- Frequently Asked Questions
- Additional Resources
What Really Breaks in an AI-Built App?
AI-built apps often break not because of traditional coding errors like syntax mistakes, but due to the inherent nature of AI interpretation and user interaction. Issues commonly arise from unpredictable AI responses, flawed user inputs that the AI misinterprets, or unexpected failures in how different system components integrate.
Differentiating between "hard" errors, like a failed API call that halts the process entirely, and "soft" errors, such as an AI summary that misses the user's core intent, is crucial for effective debugging. The biggest challenge often lies in ambiguity: the AI might interpret your prompt in a way you didn't intend, leading to outputs that are technically correct but functionally wrong.
| Traditional Bugs | AI-App Bugs |
|---|---|
| Null pointer exceptions | Prompt misinterpretation |
| Syntax errors | Logical drift in AI reasoning |
| Memory leaks | Inconsistent or irrelevant output |
| Off-by-one errors | Unanticipated agent behavior |
| Unhandled exceptions in code | Misunderstanding of user intent |
| Network connectivity failures | Flawed data parsing or generation |
Your First Step: Building a Simple 'Action Log' Feature
Creating a basic action log is your foundational step to understanding user behavior within your application. You can achieve this by prompting Lovable to create a dedicated data table that records key user actions and significant system events. This provides a chronological history of what users are doing and what the app is doing in response.
To set this up, instruct Lovable with a prompt like: Create a new table called 'ActionLog' with columns for Timestamp, UserID, ActionDescription, and Outcome. Once the table is created, you'll need to augment your existing workflows. For instance, after a user generates a report within your app, add a step to that workflow that writes an entry to the ActionLog table, detailing the action and its outcome.
Here's a simplified workflow: User performs an action (e.g., clicks a button) ↓ App logic processes the action ↓ An entry is written to the 'ActionLog' table detailing the event
How to Track Errors Without Writing Any Code
You can effectively track errors without writing a single line of traditional code by establishing a rule within Lovable that automatically logs failed operations or unexpected outputs into a separate 'Error Log' table. This ensures that critical failure data is captured and separated from general activity logs, making it much easier to spot and diagnose serious problems.
Prompt Lovable to: Create a new table called 'ErrorLog' with columns for Timestamp, UserID, ErrorMessage, and WorkflowName. After this table is created, identify the most critical workflows in your app and integrate error-handling logic. For example, in your 'Process Invoices' workflow, you would add a rule stating: 'If an error occurs during invoice processing, add the details to the ErrorLog table and then notify the user of the issue.'
Designing Your 'Debugger's Dashboard' in Lovable
To make your collected logs actionable, build a simple debugger's dashboard within your Lovable app itself. This involves creating a new, protected page that displays your 'ActionLog' and 'ErrorLog' tables in a clear, readable, and filterable format.
Instruct Lovable: Create a new page called 'Admin Dashboard' that is only visible to Admin users. On this page, display the 'ActionLog' and 'ErrorLog' tables. To make this dashboard truly useful, add search and filter functionalities. This will allow you to quickly sort logs by UserID, filter by date range, or search for specific action types, giving you immediate insights into your app's behavior and potential issues.
The architecture of this setup involves your core application logic communicating with your data tables (where the logs are stored), and your admin dashboard page accessing these tables to display the information.
Using Lovable's AI to Analyze Your Own Logs
One of the most powerful aspects of Lovable is the ability to leverage its built-in AI to analyze the very logs you've collected. You can prompt the AI to summarize error patterns, identify frequently occurring issues, and even suggest potential causes based on the data in your log tables.
Implement a new AI-driven feature within your admin dashboard that reads from the 'ErrorLog' table. You can then use prompts like: Analyze the data in the ErrorLog table. What is the most frequent error message in the last week? You can also ask for correlations: Are errors in the 'GenerateReport' workflow correlated with a specific user or time of day? This transforms your passive log data into an active, intelligent diagnostic tool, helping you pinpoint problems more effectively.
Crafting the Right Prompts to Find and Fix Bugs
To effectively isolate and resolve bugs, you need to use specific, structured prompts that guide Lovable's AI to review your app's logs and logic for a particular failed process. Generic prompts like 'My app is broken' are far less effective than detailed, contextual queries.
Instead, try a prompt such as: A user reported an error generating a report at 3:15 PM today. Review the ActionLog and ErrorLog around that time for UserID '123' and identify the step where it failed. You can also use Lovable's chat feature to review specific logic directly: Show me the logic for the 'Process Invoices' workflow. Is there a step missing for handling invoices with a zero balance?
A comparison between prompt styles highlights the difference:
Ineffective Prompt: "Fix bug in report generation." Effective Prompt: "User Jane Doe reported an error on 2023-10-27 at 10:05 AM when trying to generate a monthly sales report. Fetch her actions from the ActionLog and any associated errors from the ErrorLog for that timestamp and UserID '$JaneDoeID'. Analyze the sequence of events to pinpoint the failure."
Replaying a User Session: The Low-Code Method
Reconstructing a user's exact journey through your application can be incredibly insightful when troubleshooting. You can achieve a low-code 'session replay' by filtering your 'ActionLog' for a specific user ID and then reviewing the sequence of events in chronological order.
On your Admin Dashboard, simply filter the 'ActionLog' table by a single UserID and sort the results by timestamp. This provides a detailed, step-by-step history of their interaction with the app, revealing exactly what they did leading up to an error. This method is far more powerful than relying on a user's description of what they did, as it provides an objective record of their actions.
Closing the Loop: A Framework for Continuous Improvement
The insights gained from your debugging efforts should feed back into improving your application. By using the information from your logs, you can write new, targeted prompts that refine your app's features and fix underlying issues. This creates a cycle of continuous improvement.
Adopt the 'Log -> Analyze -> Refine -> Deploy' framework. First, you 'Log' user actions and errors. Next, you 'Analyze' these logs, often with AI assistance, to identify problems. Based on your analysis, you 'Refine' the app by prompting Lovable to add better error handling, optimize logic, or clarify instructions. Finally, you 'Deploy' these changes. The improved app then continues to 'Log' behavior, feeding back into the next iteration of the cycle.
Preventative Maintenance: Running a Monthly 'Health Check'
To proactively maintain your app's health and prevent issues before they impact your users, schedule a monthly 'system audit.' This involves running a specific prompt that asks Lovable's AI to review your app for potential problems, inefficiencies, or areas for improvement.
Use a prompt inspired by common software maintenance practices: Perform a comprehensive audit of my app. Identify any redundant workflows, unused data tables, logic that could be simplified, or potential security vulnerabilities based on current best practices. Treat this as a regular check-up, similar to taking your car for a yearly service. This proactive approach helps catch potential problems early and ensures your app operates smoothly.
When to Call a Human: Recognizing AI's Limits
While Lovable's AI is a powerful tool, it's essential to recognize its limitations. There will be times when persistent, complex backend errors or intricate integration challenges exceed the AI's ability to resolve them. This is the point where seeking human technical expertise becomes necessary.
If you've logged an error, analyzed it with the AI, and attempted multiple fixes without success, it's a strong indicator that expert human intervention is required. When you do reach out, prepare a 'developer handoff' package. This should include a clean export of the relevant logs, a clear description of the failed fix attempts, and a link to the user session replay from your 'ActionLog.' This detailed information will significantly speed up the process for any technical helper.
Conclusion and Next Steps
By implementing logging and error-tracking features directly within your Lovable applications, you transform the way you manage and maintain your software. You move from a reactive stance, struggling with unknown issues, to a proactive one, empowered by data and intelligent analysis. This approach ensures your internal tools remain robust, reliable, and continue to drive business value without constant firefighting.
Your journey to bulletproof internal apps starts now. Here are actionable next steps you can take today:
- Prompt Lovable to create your 'ActionLog' and 'ErrorLog' tables. This is the foundational step that will provide the data you need for all subsequent debugging efforts.
- Update your critical existing workflows to write to these new log tables. Start with the most important user journeys or automated processes.
- Design and build your 'Admin Dashboard' page. Make it accessible only to administrators and ensure your logs are displayed in a readable format.
- Experiment with AI analysis prompts on your newly collected log data. Ask Lovable to summarize errors or identify patterns.
- Practice reconstructing user sessions by filtering the 'ActionLog' for specific users who report issues.
Frequently Asked Questions
Can Lovable AI debug my app for me automatically?
While Lovable's AI can't fully automate the debugging process without your input, it can significantly help you build the tools (like logs and dashboards) needed for debugging. It can also analyze the data collected to pinpoint root causes. You act as the director, guiding the AI to find and fix issues within the app you've built.
Which AI tool is best for debugging?
For an app built with Lovable, the most effective debugging tool is Lovable's own AI integrated within the platform. Using the AI to analyze logs you've constructed within the app provides the most direct and context-aware insights, rather than relying on external, disconnected tools.
Do I need to code to debug my Lovable app?
No, you do not need to write traditional code to debug your Lovable app using these methods. The entire process is based on crafting natural language prompts to build logging features, analyze data, and refine your application's logic.
Is debugging harder than building the app in the first place?
It can feel harder if you're debugging a broken app reactively. However, if you proactively build logging and error-tracking features from the start, debugging becomes a manageable, routine process rather than a crisis. It's about establishing good maintenance practices.
What's the most common 'bug' in an AI-built app?
The most common issues are often 'soft bugs,' where the AI interprets a prompt in an unintended way, or where its output is inconsistent, unhelpful, or slightly off target, rather than a hard crash or critical system error. These require careful prompt refinement and log analysis.
How much does it cost to add logging to my Lovable app?
Adding basic logging primarily utilizes your app's existing resources by adding rows to your data tables. For most internal business apps built on Lovable, the associated data storage and processing costs are generally negligible compared to the value of having debuggable applications.
Can I use an external tool like Sentry or LogRocket with Lovable?
While technically possible for advanced users or those working with developers, the approach of building logging and error tracking directly within Lovable is far simpler and more integrated for non-technical founders. It keeps your entire app and its maintenance tools within a single, familiar environment.
What is 'vibe coding'?
'Vibe coding' is another term for prompt-based programming. You describe the desired functionality, the overall feel ('vibe'), and the specific requirements of what you want to build, and the AI translates that description into a working application.
How can I share a bug with a developer for help?
To effectively share a bug with a developer, create a 'bug report package.' This should contain an export of the relevant error and action logs, a step-by-step 'session replay' derived from your action log, and a clear description of the issue and steps taken to attempt a fix. This is infinitely more helpful than a simple bug description.
Which AI does Lovable use?
Lovable abstracts the specific AI models away from the end-user. It likely utilizes a blend of leading AI models, allowing you to interact with its capabilities through the Lovable interface without needing to manage individual AI model complexities or API keys. The focus is on the functionality provided, not the underlying model.