
Google Sheets Canvas Tutorial: Ditch Notion for a Simpler Project Dashboard
Tired of Notion's complexity but need more than a static spreadsheet? Google Sheets' new canvas feature is a gamechanger for teams living in Google Workspace. It transforms your raw spreadsheet data into a dynamic, interactive dashboard where you can manage projects, track budgets, and visualize...

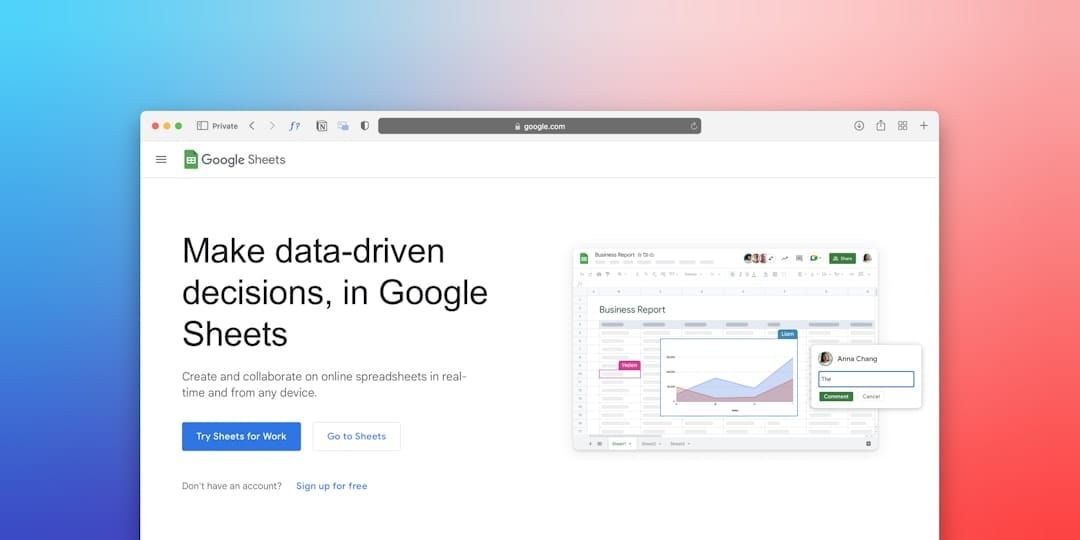
Tired of Notion's complexity but need more than a static spreadsheet? Google Sheets' new canvas feature is a game-changer for teams living in Google Workspace. It transforms your raw spreadsheet data into a dynamic, interactive dashboard where you can manage projects, track budgets, and visualize timelines without ever leaving Sheets. This tutorial provides a practical walkthrough, showing you exactly how to turn a basic project tracker into a powerful visual hub for your entire team. A Sheets canvas is an interactive and customizable visual layer built on top of your Google Sheets data, allowing you to create mini-applications and dashboards directly within your spreadsheet.
Key Takeaways: Your First Sheets Canvas Dashboard
- Structure your core project information—tasks, owners, due dates, status, budget—in a clean, organized table on a dedicated tab in your Google Sheet.
- Use the 'Create a canvas' command, powered by a Gemini prompt, to instantly generate a visual layout like a Kanban board from your project data.
- Customize your dashboard by adding charts for budget tracking, cards for tasks, and interactive filters for status or team members.
- Link visual elements directly to your spreadsheet cells and named ranges, creating a single source of truth where updating the sheet instantly updates the canvas.
- Share your new dashboard with your team using standard Google sharing permissions for real-time collaboration and updates.
- Avoid common pitfalls by keeping your raw data on a separate tab and building focused, single-purpose canvases instead of one overloaded dashboard.
Table of contents
- What Is Sheets Canvas (and What It Isn't)?
- Who Can Access the Canvas Feature? A Quick Eligibility Check
- Preparing Your Data: The Foundation of a Great Dashboard
- Generating Your First Canvas from a Simple Prompt
- Designing Your Interactive Project Dashboard: A Walkthrough
- Sheets Canvas vs. Notion: A Practical Comparison for Teams
- The Technical Architecture of a Canvas Application
- Exploring Other Visualizations Beyond Kanban Boards
- Collaborating on and Sharing Your Live Dashboard
- Best Practices and Common Pitfalls to Avoid
- Conclusion and Next Steps
- Frequently asked questions
- Additional Resources
What Is Sheets Canvas (and What It Isn't)?
Sheets canvas is a feature within Google Sheets that allows you to build interactive mini-applications and dashboards directly on top of your spreadsheet data, powered by Google's Gemini AI. It's important to distinguish it from other tools with similar names; this is not the separate 'Google Canvas' drawing application nor is it related to the 'Canvas' Learning Management System used in education. Its primary purpose is to visually represent and interact with your data in more dynamic formats, such as Kanban boards, project timelines, and resource planners. Think of it as a lightweight, fully integrated competitor to dashboarding capabilities found in platforms like Notion or Airtable, but with the advantage of being natively part of the Google Workspace ecosystem.
For example, instead of just seeing a long list of tasks in a spreadsheet, you can prompt Sheets canvas to create a Kanban board where you can drag and drop tasks between "To Do," "In Progress," and "Done" columns, with each card directly linked to the corresponding row in your sheet. This makes project management visually intuitive and highly actionable, all without leaving your familiar Sheets interface.

Who Can Access the Canvas Feature? A Quick Eligibility Check
To use the Sheets canvas feature, you'll need an eligible Google Workspace or Google AI plan, as specified in Google's official documentation. It's currently unavailable on mobile devices and only works with files stored within Google Drive, meaning you can't access it for files saved in third-party cloud storage or those stored locally. You might also encounter performance issues with excessively large datasets; in such cases, creating a summary tab with aggregated data can help improve responsiveness.
To confirm your eligibility, you can check your Google Workspace subscription details through your administrator portal or your personal account settings. For instance, users on Business Standard, Business Plus, Enterprise Standard, Enterprise Plus, Education Standard, Education Plus, and the Teaching and Learning Upgrade plans, as well as Google One AI Premium subscribers, typically have access. If you find the "Create a canvas" option is greyed out, it's likely an eligibility or plan-related issue.
Preparing Your Data: The Foundation of a Great Dashboard
The success of your Sheets canvas dashboard hinges on well-structured and clean data within your Google Sheet. A robust project tracking spreadsheet should include essential columns such as 'Task Name', 'Owner', 'Due Date', 'Status', and 'Budget'. Using features like Data Validation to create standardized dropdown menus for fields like 'Status' (e.g., "Not Started," "In Progress," "Completed," "Blocked") ensures consistency.
This meticulously organized data table serves as the "backend" or the single source of truth for your entire interactive canvas. For example, imagine a simple project tracker:
| Task Name | Owner | Due Date | Status | Budget |
|---|---|---|---|---|
| Design Mockups | Alice | 2023-10-26 | In Progress | $500 |
| Develop Frontend | Bob | 2023-11-10 | Not Started | $2000 |
| Write API Endpoints | Charlie | 2023-11-15 | Not Started | $1500 |
| User Testing | Alice | 2023-11-20 | Not Started | $300 |
This structured format makes it easy for Sheets canvas to interpret and visualize your data effectively.
Generating Your First Canvas from a Simple Prompt
To begin creating your Sheets canvas, select the range of data you want to visualize. Then, navigate to the Insert menu and choose Canvas. This action will open a prompt interface, similar to interacting with Gemini directly. Here, you can describe the visual layout you envision for your data.
For instance, if you have the project tracker table from the previous section, you might prompt Gemini with: "Create a Kanban board using the Status column for lanes and display Task Name and Owner on each card." Gemini will then interpret this request and generate an initial canvas layout based on your data. You'll see cards representing your tasks, organized into columns corresponding to their "Status," allowing for immediate visual inspection of your project's progress.
If the 'Create a canvas' option is unavailable, double-check your plan eligibility and ensure your data is formatted correctly in a standard Google Sheet tab.
Designing Your Interactive Project Dashboard: A Walkthrough
Once your initial canvas is generated, the real power of Sheets canvas comes into play through customization. Taking the Kanban board example, you can start adding more visual components to create a comprehensive project dashboard. This involves adding elements like charts to track budget spend over time, progress bars for task completion, or even text cards for project summaries.
Crucially, each visual element needs to be linked to specific cells or named ranges in your underlying spreadsheet. This ensures that as your data in the sheet updates, the canvas reflects those changes instantly. For example, you could add a dropdown menu to your canvas that filters the displayed tasks by selecting a specific team member, pulling that filtering logic directly from a helper range in your sheet.
This workflow ensures that your dashboard is not just a static representation but a dynamic interface.
Sheets Canvas vs. Notion: A Practical Comparison for Teams
For teams deeply embedded in the Google Workspace ecosystem, Sheets canvas offers a compelling alternative to Notion's more expansive but often complex project management capabilities. Sheets canvas excels when your primary need is to visualize and interact with data that already resides in your spreadsheets, avoiding the need for context switching or data duplication. Notion, on the other hand, is a broader workspace tool, better suited for document-centric collaboration, knowledge bases, and more complex, multi-purpose databases.
| Feature | Google Sheets Canvas | Notion |
|---|---|---|
| Data Source | Live within Google Sheets | Dedicated Notion Databases |
| Learning Curve | Low (integrated with familiar Sheets) | Moderate to High (requires learning its own database system) |
| Integration | Native to Google Workspace | Integrates via APIs or manual efforts |
| Cost | Included with eligible paid Google Workspace/AI plans | Separate subscription tiers |
By keeping project tracking within Sheets, teams can reduce "tool sprawl" and leverage existing familiar workflows, making it particularly beneficial for finance, operations, and data-intensive project management scenarios.
The Technical Architecture of a Canvas Application
A Sheets canvas operates on a two-layer architecture, mirroring the separation of concerns common in application development. The "Data Layer" is your Google Sheet itself, acting as the robust backend. This layer houses the raw information, any underlying formulas, and the core business logic that governs your data.
The "Presentation Layer" is the interactive canvas UI that you build and interact with. This frontend reads data from the Data Layer to display visuals and can also write data back to the sheet based on user input. This clear separation is advantageous because it allows you to redesign or update the visual presentation (the canvas) without risking the integrity or structure of your core data, ensuring a stable and maintainable system.
+---------------------+      +---------------------+
|    Data Layer       |      |  Presentation Layer |
| (Google Sheet Tab)  |      |   (Sheets Canvas)   |
|---------------------|      |---------------------|
| - Raw Data          | <--->| - Visual Components |
| - Formulas          |      |   (Cards, Charts)   |
| - Business Logic    |      | - Interactive Controls|
| - Named Ranges      |      |   (Filters, Buttons)|
+---------------------+      +---------------------+
Exploring Other Visualizations Beyond Kanban Boards
While Kanban boards are a popular starting point, Sheets canvas is highly versatile, allowing you to create a wide array of visualizations tailored to different data analysis needs. You can transform your spreadsheet data into project timelines that visually map tasks with their start and end dates, similar to a Gantt chart, providing a clear overview of your project schedule.
Another powerful application is a team resource planner. This can be built using a matrix layout to show how tasks are allocated across different team members, highlighting potential bottlenecks or over-allocation. For financial tracking, a budget monitoring dashboard is easily achievable, combining cards for key financial metrics, progress bars to show spend against budget, and pie charts to break down expenses by category.
These diverse visualization options allow teams to move beyond static tables and gain deeper, more actionable insights from their data.
Collaborating on and Sharing Your Live Dashboard
Sharing a Sheets canvas is as straightforward as sharing any other Google Sheet or Doc, utilizing the familiar 'Share' button and its associated permission controls. You can grant 'View', 'Comment', or 'Edit' access to your canvas, allowing for scenarios ranging from read-only dashboards for stakeholders to fully collaborative workspaces where team members can update task statuses or input new data directly.
The beauty of this integration lies in its real-time nature. Any changes made to the underlying spreadsheet data by one user are instantly reflected on the canvas for all viewers. This ensures everyone is working with the most up-to-date information without manual refresh steps. The primary method for distributing your dashboard is by sharing the direct link to the Google Sheet.
Best Practices and Common Pitfalls to Avoid
To ensure your Sheets canvas remains effective and easy to manage, adhere to a few key best practices. First, always keep your raw, foundational data on a separate, protected tab within your spreadsheet. This prevents accidental modifications or deletions by users who might only interact with the dashboard view.
A common pitfall is attempting to create a single, all-encompassing canvas that tries to visualize every piece of data. Instead, recommend creating multiple, focused dashboards for different purposes or user groups. For example, one canvas for project task management and another for budget overview. Utilizing 'Named Ranges' in your spreadsheet for key data areas also makes linking canvas elements more stable and easier to manage over time.
Here's a summary framework for the creation process:
- Structure Data: Organize your raw data into a clean, tabular format on a dedicated sheet tab.
- Define Goal: Clearly identify the purpose and key metrics of the dashboard you want to create.
- Generate Canvas: Use a concise Gemini prompt to create the initial visual layout.
- Customize & Link: Add relevant visual components and ensure they are correctly linked to your spreadsheet data.
- Share & Iterate: Share with your team, gather feedback, and refine the canvas as needed.
Conclusion and Next Steps
You've now learned how Google Sheets canvas can transform your data-driven workflows, offering a powerful yet user-friendly way to build interactive dashboards and mini-applications directly within the familiar environment of Google Sheets. By leveraging Gemini AI and a structured approach to your data, you can move beyond static spreadsheets to dynamic, collaborative visual tools.
This feature empowers teams to manage projects, track progress, and gain insights without the complexity often associated with dedicated project management software, all while staying firmly within the Google Workspace ecosystem.
Here are your concrete next steps to get started:
- Organize Your Data: Dedicate a tab in an existing or new Google Sheet to structure your core project data (tasks, owners, dates, status, budget, etc.).
- Initiate Canvas Creation: Select your data range, go to
Insert > Canvas, and craft a prompt for your desired visualization, like a Kanban board. - Customize and Link: Refine the generated canvas by adding charts, cards, and filters, ensuring each element is linked back to your spreadsheet cells.
- Test Interactivity: Interact with your new dashboard to ensure filters, drag-and-drop functionality, and data updates work as expected.
- Share with Your Team: Use the standard Google sharing features to grant access to your collaborators and gather initial feedback.
Frequently asked questions
How do you use canvas in Google Sheets?
To use Sheets canvas, you select your data range, find the 'Create a canvas' option (typically under the 'Insert' or 'Tools' menu), and use a prompt to generate a visual layout powered by Gemini AI. You can then customize this generated layout to build your interactive dashboard.
Where is the canvas menu in Google Sheets?
The exact location of the 'Create a canvas' menu option can vary slightly but is generally found under the Insert menu or within the Tools menu, often linked to Gemini features. If the option is not visible, it may indicate that your current Google Workspace or AI plan is not eligible for the feature.
Is Google Sheets canvas free?
No, the Google Sheets canvas feature is not universally free. It requires an eligible, paid Google Workspace or Google AI plan, such as Google One AI Premium, or specific Workspace business and education tiers.
Can I use Sheets canvas on my phone?
No, the Google Sheets canvas feature is currently only available on desktop browsers and is not supported on the mobile Google Sheets application.
What is the difference between Sheets canvas and Google Looker Studio?
Sheets canvas is designed for creating interactive mini-applications and dashboards within a Google Sheet, directly on top of its data. Google Looker Studio, on the other hand, is a standalone business intelligence tool used for building comprehensive reports and dashboards from a wide variety of data sources, including but not limited to Google Sheets.
Can my Sheets canvas update automatically when I change the data?
Yes, that is the core functionality of Sheets canvas. It acts as a live presentation layer for your underlying Google Sheet, meaning any data changes made in the sheet are instantly reflected on the canvas, and vice versa for editable elements.
Does Sheets canvas work with imported Excel files?
No, Sheets canvas requires the data to be in a native Google Sheet format. If you have an Excel file, you will need to convert it to a Google Sheet first by opening it in Google Drive and using the 'Save as Google Sheets' option.
How is this different from just making a chart in Google Sheets?
While charts in Google Sheets provide a single visualization of data, a canvas allows you to build a complete, multi-component interactive layout. This includes various elements like cards, filters, buttons, and dynamic layouts that function more like a mini-application than a standalone chart.
Can I embed my Sheets canvas on a website or in Google Slides?
Currently, you cannot directly embed the interactive Sheets canvas itself onto a website or within Google Slides. However, you can share the direct link to the Google Sheet, or potentially embed a published, non-interactive view of the sheet data if that meets your needs.
What are some practical examples of what I can build?
Practical examples of what you can build with Sheets canvas include interactive project management Kanban boards, team resource planners to visualize workload, detailed budget tracking dashboards with charts and progress indicators, and visual project timelines to map out key milestones and deadlines.
Additional Resources
Watch
- Creating and Editing with Google Canvas: A Comprehensive Tutorial — The video demonstrates building a live document within Canvas, adjusting formatting, and generating infographics and websites.


